|
CAS |
Chemical Abstracts Service |
|
GDPR |
General Data Protection Regulation |
|
QS |
Quality Standard |
|
WISE |
Water Information for Europe |
User stories
Overview
User story is an informal, natural language description of features of a software system. In this document the SIMONA-Tool’s functions are demonstrated thought user stories, written from the perspective of the end user.
Browsing publicly available data
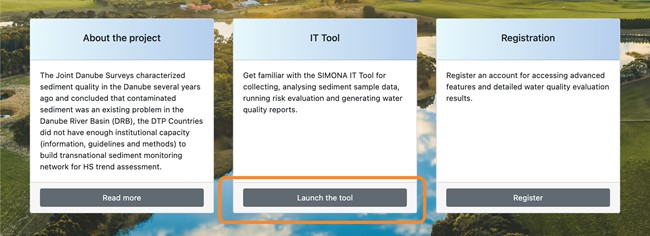
Several features are openly available to visitors without having a registered account. These are primarily related to browsing water quality monitoring sites and getting an overview of the latest water quality status. The tool can be launched from the main navigation bar or by clicking on Launch the tool button on the welcome screen.
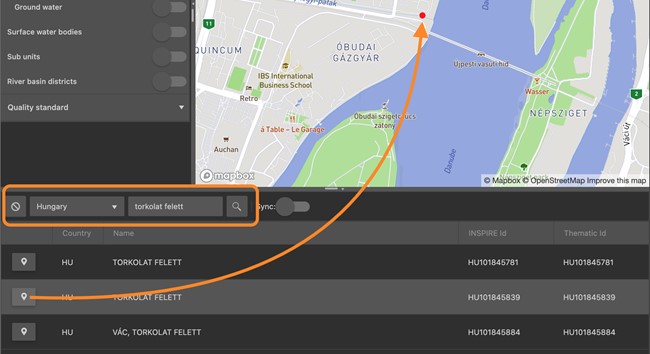
User interface elements
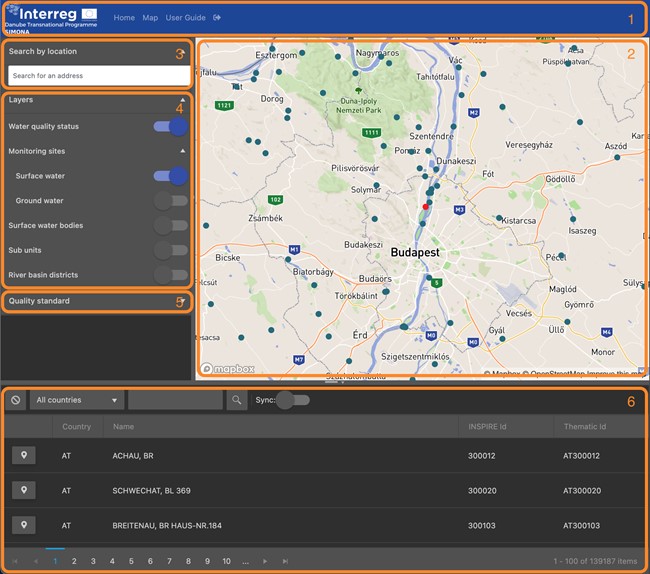
The layout of the tool’s screen is divided into six main panels:
- Main navigation bar
On the top of the screen the main navigation bar provides links to other parts of the web applica-tion. - Map
The central element of the user interface is the map displaying information about monitoring sites, water bodies and water quality status evaluation results. - Search-by-address tool
For quicker navigation the tool provides this search tools that allows users to enter a postal ad-dress then move the centre of the map to the corresponding geolocation. - Layers
On the aside panel, using the switches users can specify the kind of data to be displayed on the map. By default, surface waterbody monitoring sites and water quality status layers are selected. These layers are displayed on the map as interactive markers. By clicking those markers further details are available. - Quality standard manager
For specific user groups the quality standard manager is available on the aside panel that allows them to set up or update quality standards by specifying concentration threshold values against specific substances. - Monitoring site browser
Monitoring sites are listed at the bottom of the screen. Filtering by countries and searching by keyword is available above the list. Each record on the list provides a button that sets the centre of the map to the corresponding monitoring site’s coordinates.
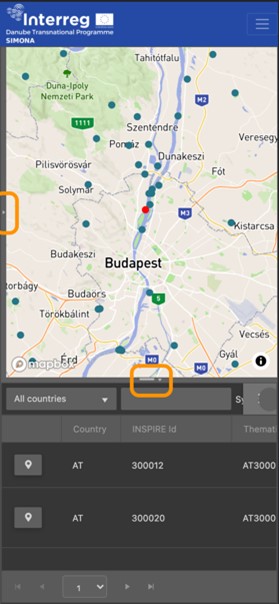
The layout is divided by two collapsible panel: one horizontal and on vertical. In case there is not enough space on the device’s screen (e.g., on mobile devices) the tool automatically hides the supporting panels that can manually be opened again.
Searching for monitoring site
Information provided by the tool is primarily available linked to specific monitoring sites. Hence a key action is to find the monitoring site of interest. The tools support this action in the following three ways.
|
Geolocation |
The map is centred to the device’s current location, if available. |
|
Geocoding service |
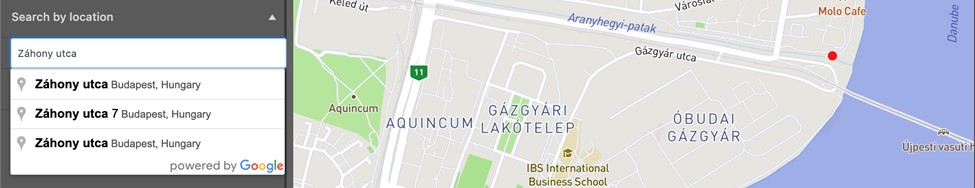
Using the search-by-address tool sites can be found by address. |
|
Search by keyword |
Monitoring sites can be found by their name using the free text search method provided by the list view on the bottom panel. |
Geocoding service allows the user to enter parts of the monitoring site’s address then select the specific address from the suggestion list.
Monitoring site list can also be used for search for a monitoring site. By entering a keyword, the list gets filtered and shows buttons that moves the map to the specific monitoring site.
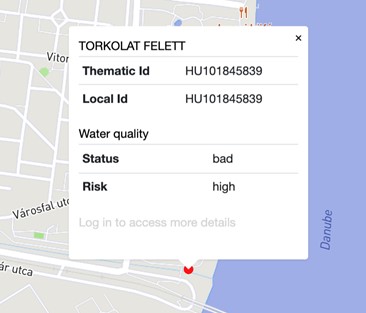
Monitoring site details
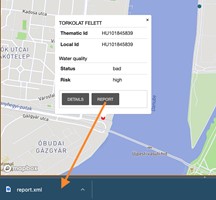
Basic monitoring site details are openly available to visitors that can be accessed by clicking on the marker of the site. Markers are linked to summary popups listing basic details about the site and the cur-rent water quality evaluation results.
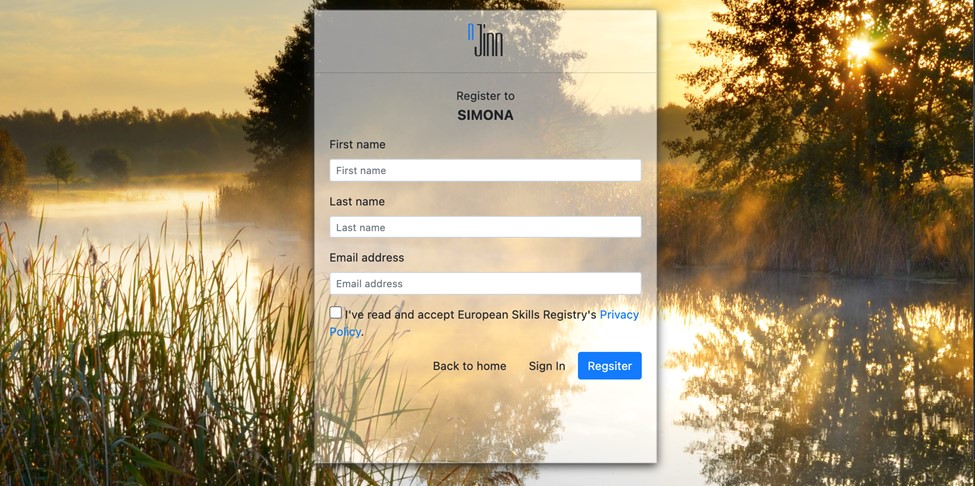
Registration
Registering an account is open to everyone and requires minimum amount of data to be entered: first name, last name and email address. These data will be stored by the platform hence subject of GDPR and the user needs to read and accept the privacy policy first.
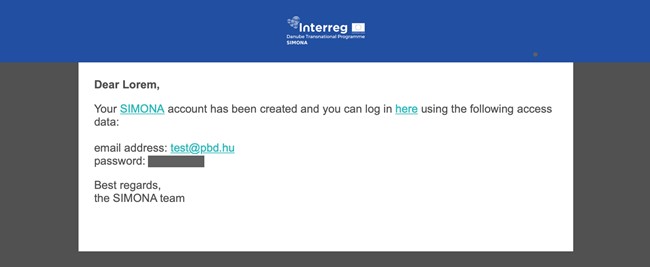
After submitting the basic personal information, a confirmation email is sent to the given email account containing a custom link that can be used to verify it.
Monitoring site details
Registered users have access to more information associated to a monitoring site depending on their role.
Risk evaluation results
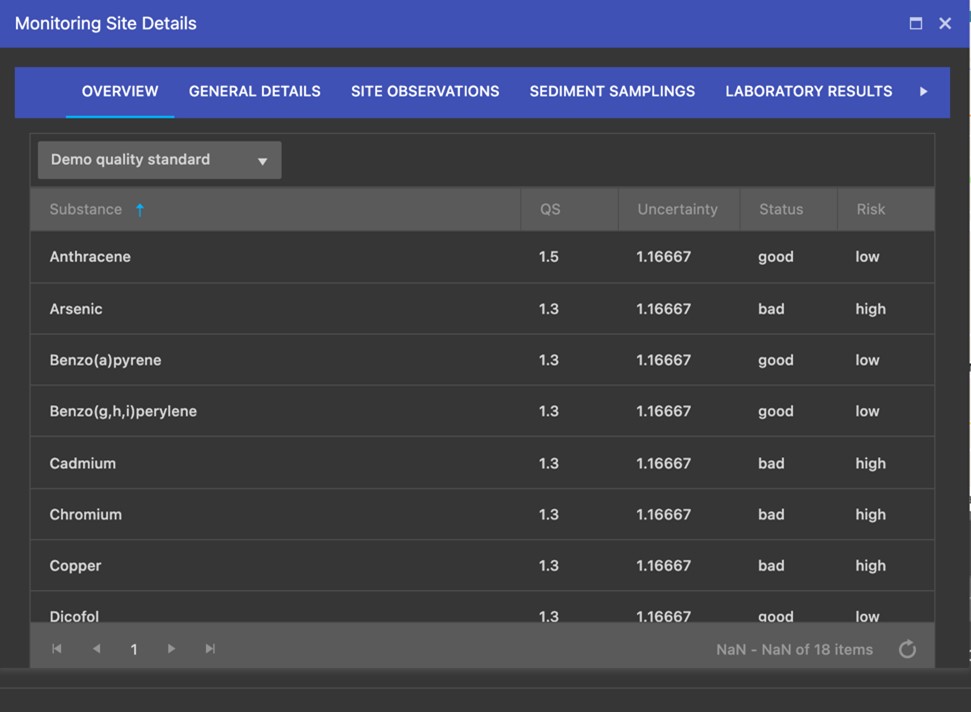
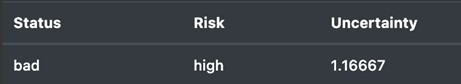
Risk assessment with regards to the selected monitoring site against a specific quality standard can be quickly carried out on the Overview tab of the Monitoring Site Details dialog. Using the drop-down list at the top of the panel one can select a quality standard. Once the standard is selected, the assessment gets performed using the threshold values defined by the standard. On the result view components are listed along with the corresponding status and risk results.
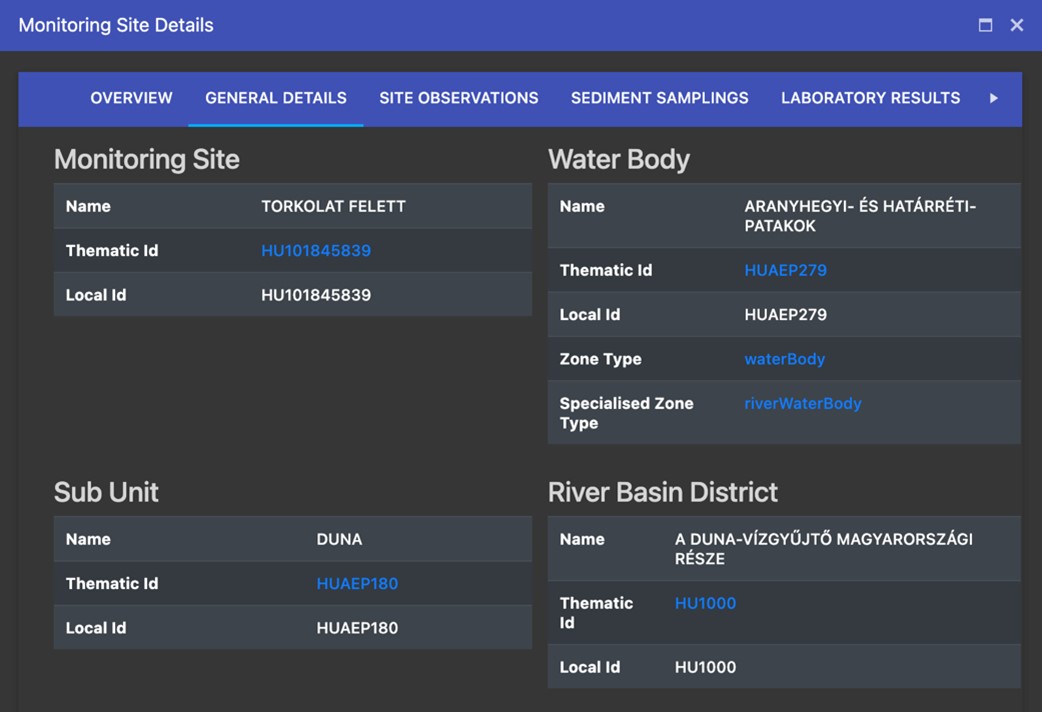
General geographic details
Monitoring sites belong to a specific geographic location. Following the WISE geographic classification, the relevant water body, sub unit and river basin district is shown. Each feature is linked to their Eionet Data Dictionary record.
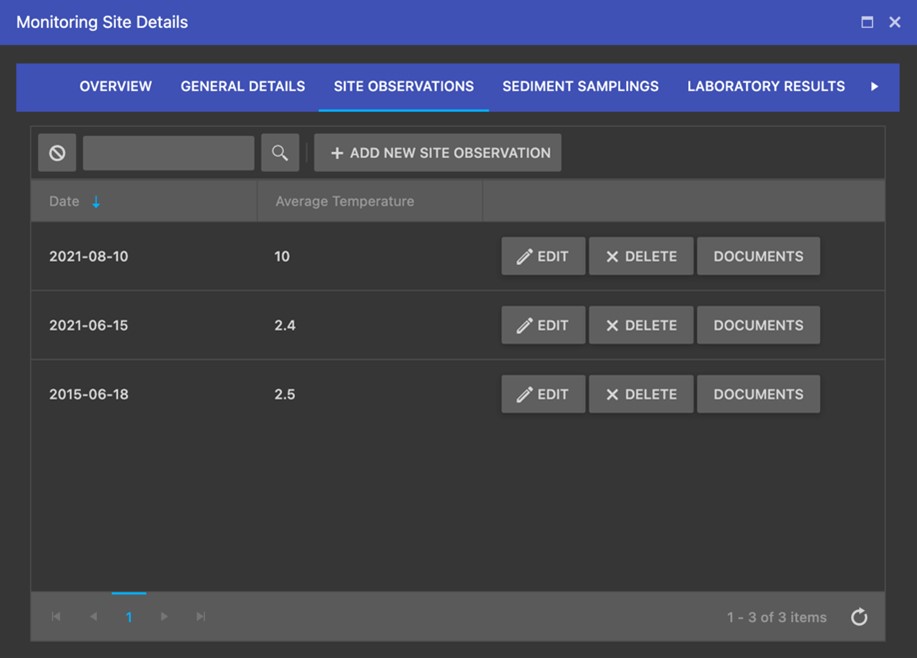
Monitoring site observations
Observation data collected during surveillance monitoring about the site is listed under the Site Observa-tions tab. The list shows each record of observations where details can be edited and documents can be stored.
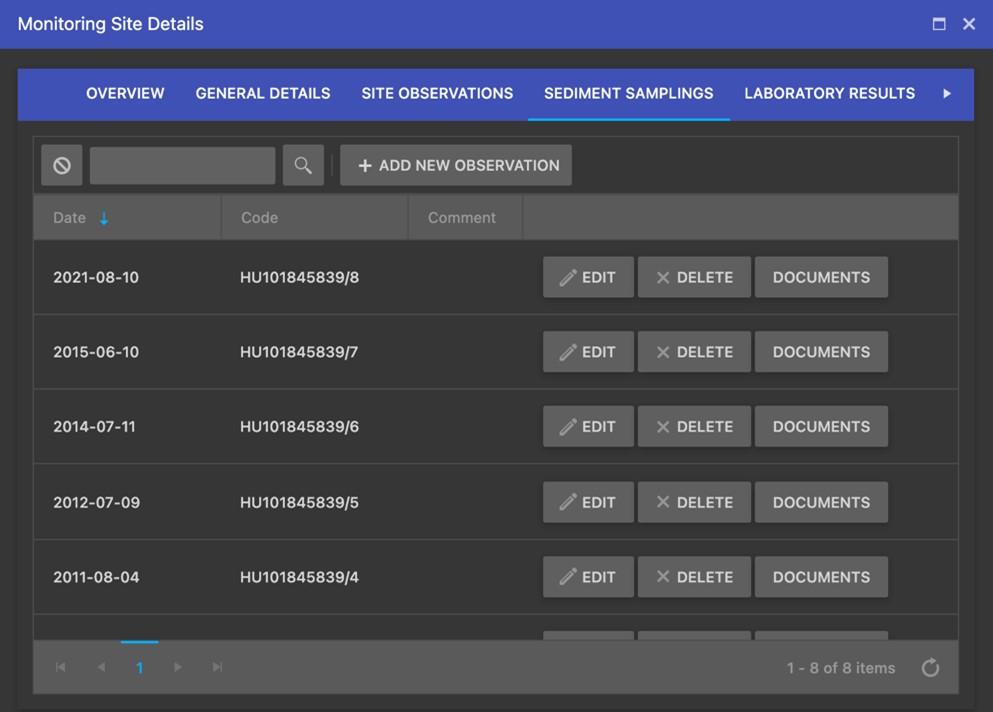
Sediment samplings
Sediment samplings in the system represent the observation event when sediment samples are collect-ed. On the Sediment samplings tab such recorded events are listed.
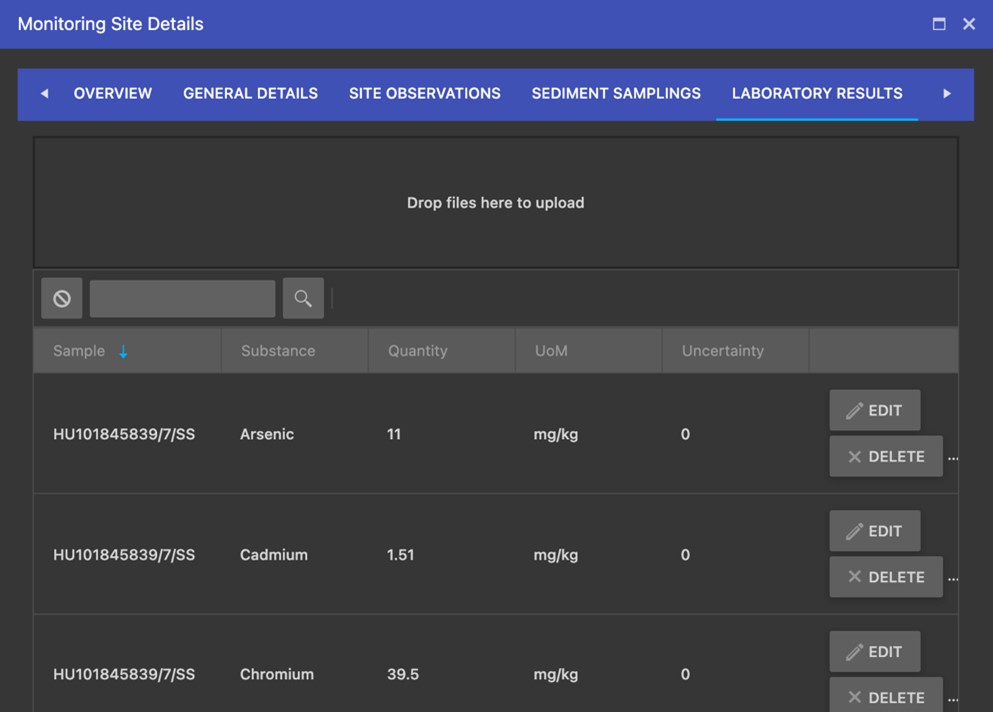
Laboratory results
On the Laboratory results tab actual concentration information is shown for each sample collected un-der the registered samplings. This data is produced by laboratories as a result of the analysis of samples
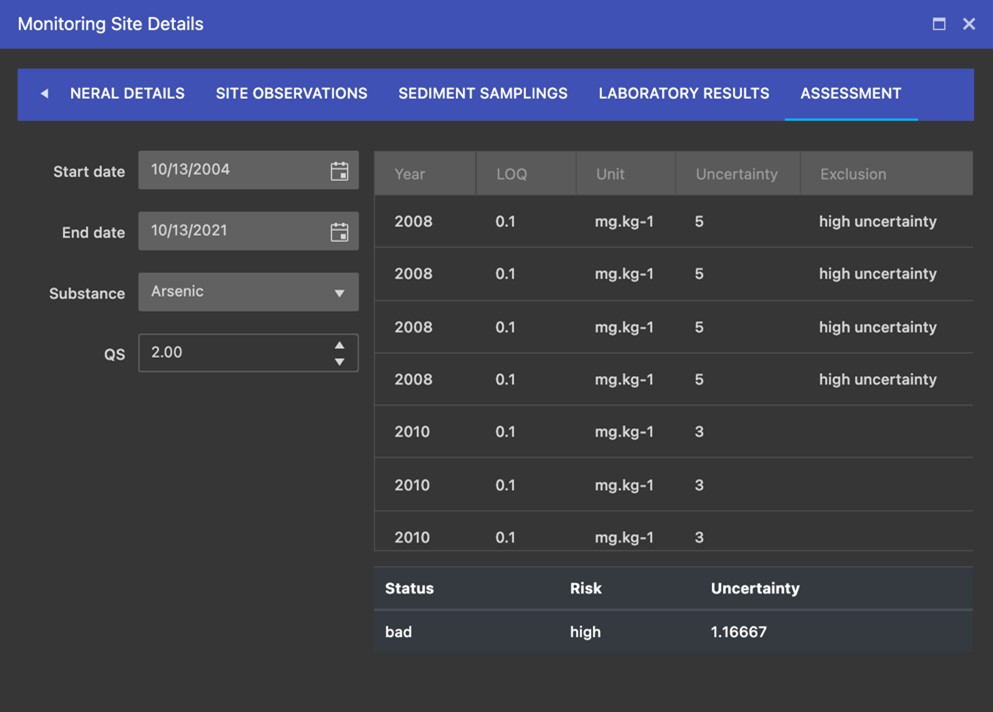
Assessments
For researchers the Assessment tab allows to run quick risk evaluation against a single substance.
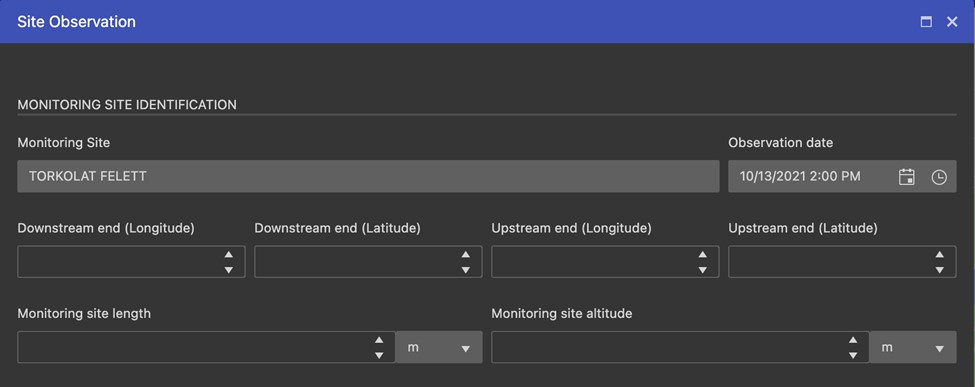
Recording monitoring site observation data
For researchers the Assessment tab allows to run quick risk evaluation against a single substance.
- Monitoring site identification
- Hydromorphology
- Hydrography
- Water quality
- Physiography
- Other site-specific features
Submitting sediment sample data
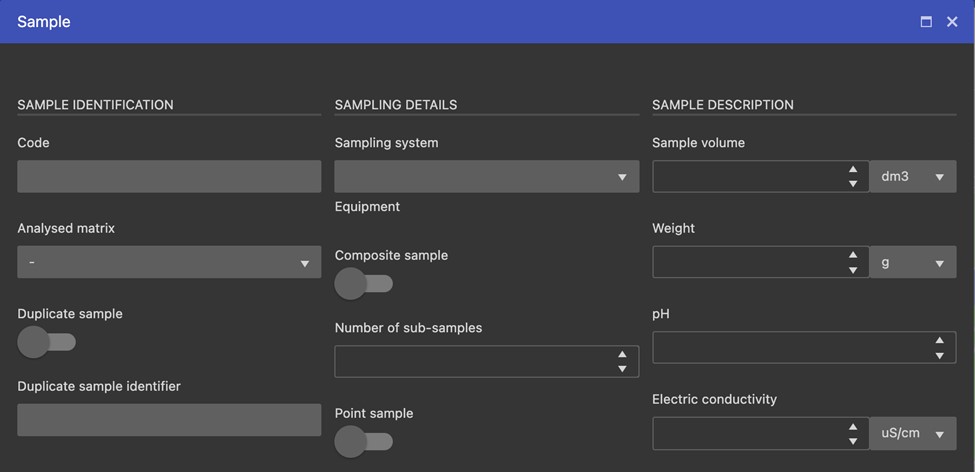
Sediment samples belong to samplings, therefore, details about the observation (e.g., sampling date, weather and water conditions) need to be entered. Once this information is given arbitrary number of samples can be added to the sampling.
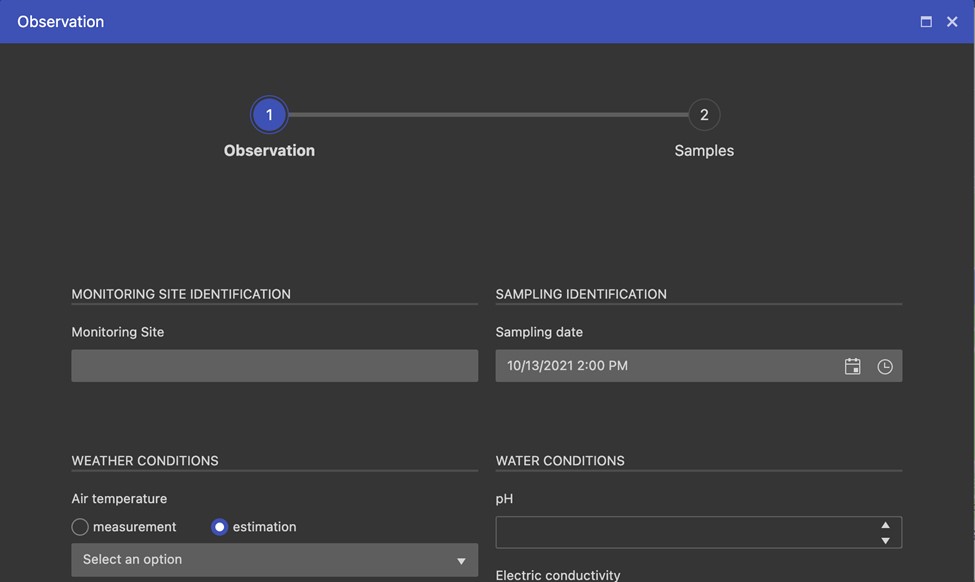
In the 2nd step information about each sample is requested
Uploading laboratory results
On the Laboratory results tab of the Monitoring Site Details dialog – for those who are allowed to upload – a file upload panel is available. Using the drag-n-drop method laboratory results can be submitted as an Excel spreadsheet.
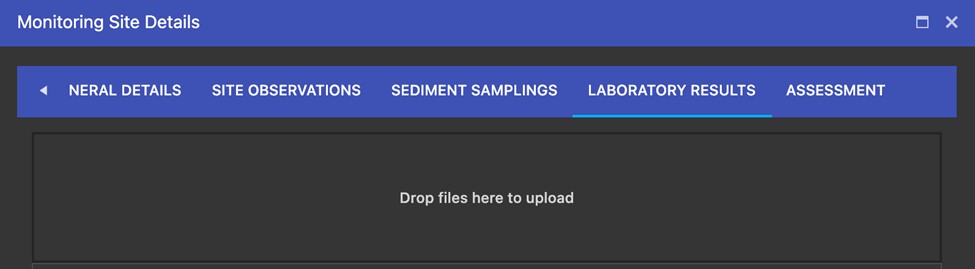
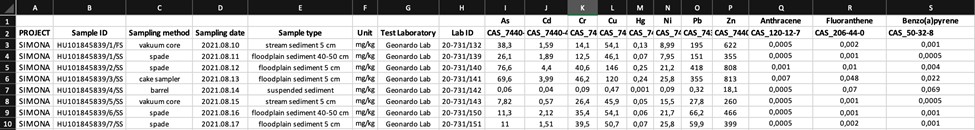
The scheme of the spreadsheet must follow a predefined structure to be processable by the system. Namely, all the components need to be referenced by their CAS code and associated to a sample identifi-er generated by the tool.
Data analysis
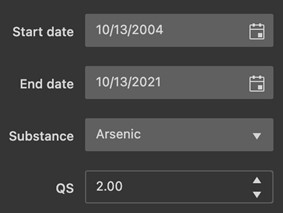
For researchers a dedicated Assessment tab is available in the Monitoring Site Details dialog. It allows the user to carry out custom assessment against the stored laboratory results using four input data: start- and end date of the period of interest, the selected substance and the custom QS value.
The assessment results are summarised in a tabular layout as well as listed by observations.
Exporting WISE compatible reports
Report generation in WISE compatible format is done by the system automatically with no further input required than pressing the Report button on the Monitoring Site Summary popup.
Add new monitoring site
Monitoring sites can be added to the database by clicking on the map and selecting the Add new monitor-ing site option.
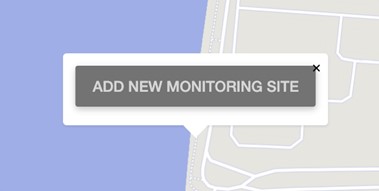
As a second step the new site’s name is required to be specified. Once it is submitted the site can be ac-cessed.
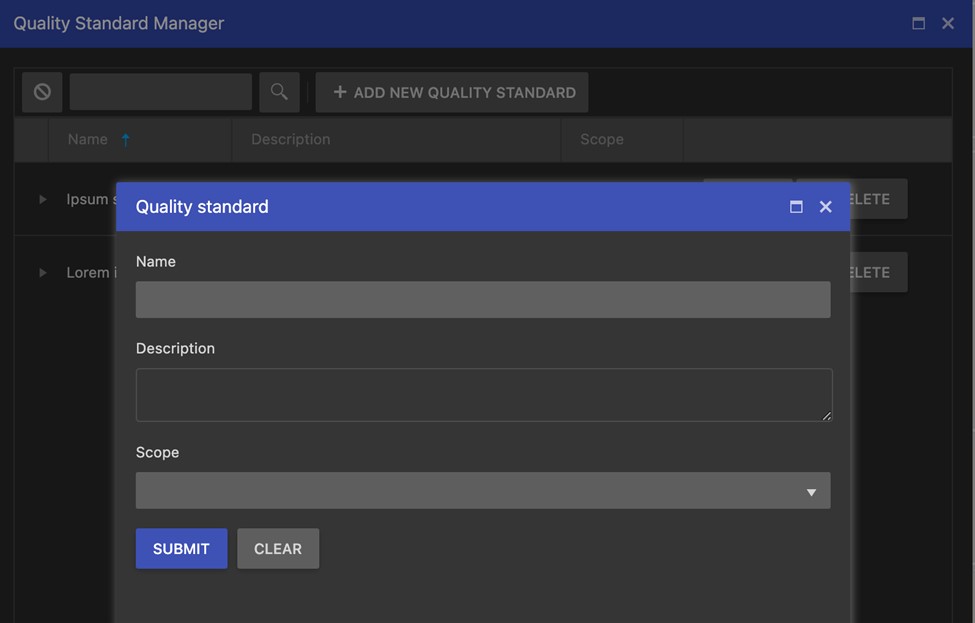
Manage quality standards
Region managers, national contacts and researchers can manage the system’s quality standard database. From the aside panel the Quality Standard Manager can be launched.
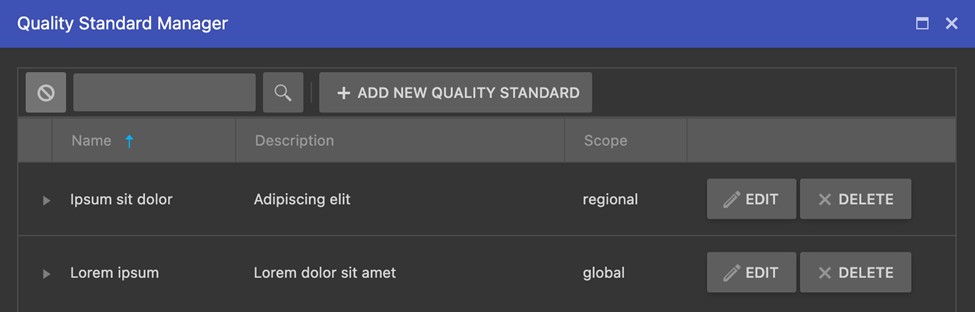
New quality standard can be added by specifying its name, description and the intended scope of it.
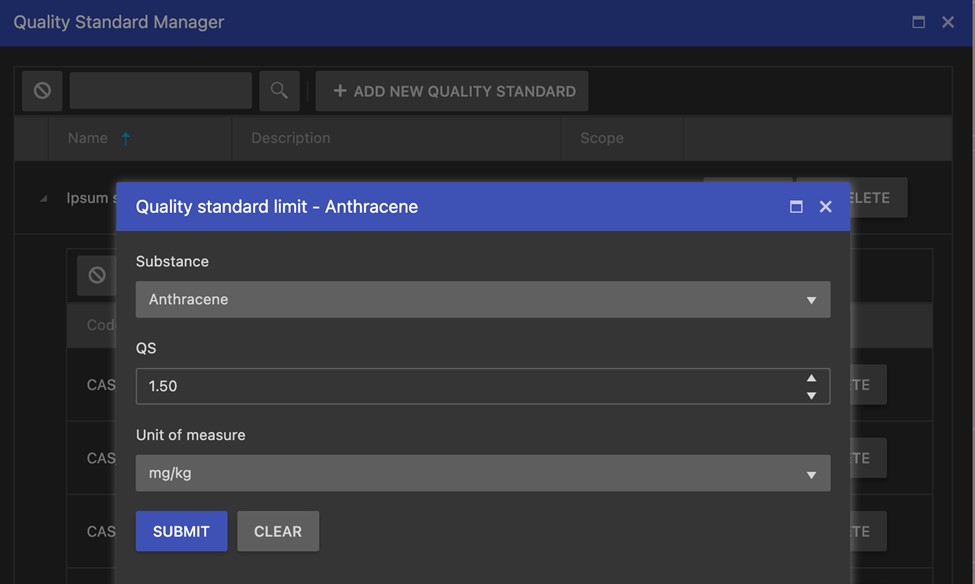
On the detail panel of each quality standard the list of substances is available along with their QS value.
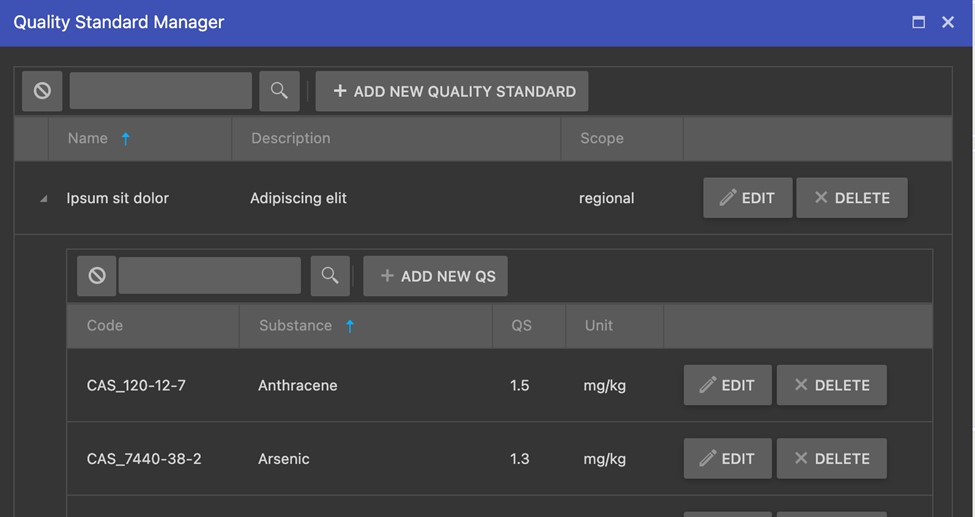
Each value can be updated by clicking on Edit and specifying the substance and the threshold in a select-ed unit of measure.
]]>